Watch a site's state
Two different things watch a connected site, and it helps to keep them apart.
The state is read through the plugin every few hours: PHP, WordPress, the schedule, the certificate, the mail, the keys. It comes back as a list of reasons.
Uptime is measured from outside on a schedule the workspace sets: every minute, every five minutes or every fifteen. Five is the default. It is one ordinary page request to the site’s own public address, the same one a visitor makes. It carries no key and asks the plugin nothing, which is the point: a site can answer ReDock perfectly and still be showing its visitors an error.
Once a week a third look, Mail and speed, reads each site’s SPF, DKIM and DMARC records through public DNS and measures how fast its home page loads on a phone. It has a page of its own: see Check mail delivery and page speed.
Reasons, not a score
Section titled “Reasons, not a score”Seventy-eight out of a hundred tells you nothing you can act on. The state is a list of what was found, and each line says what to do about it.
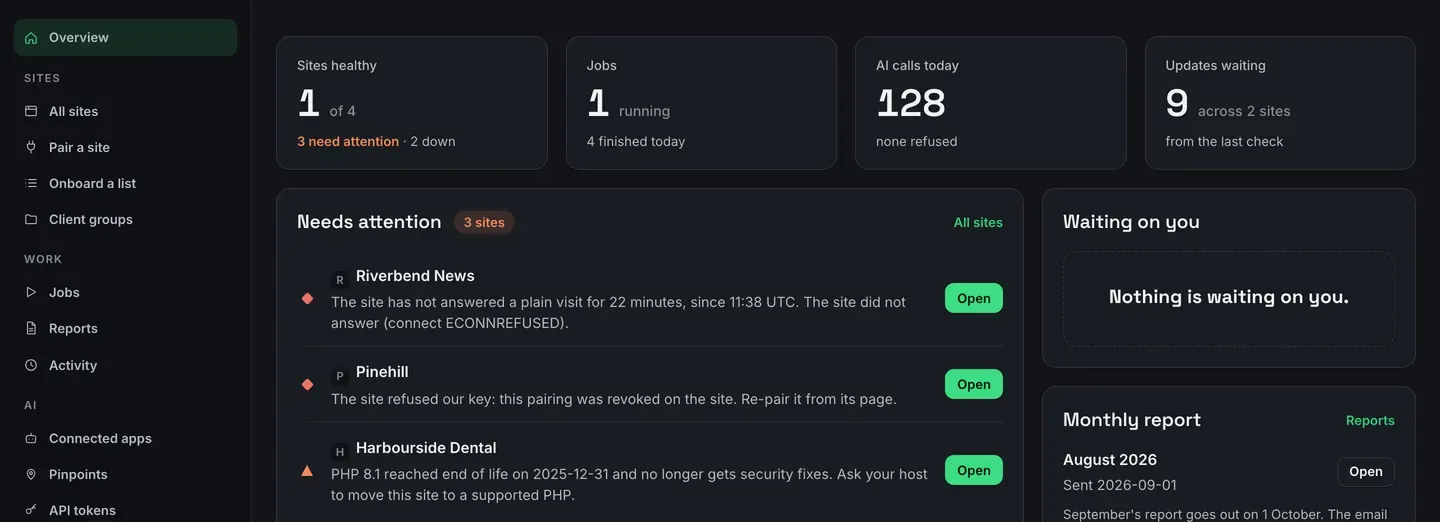
What it looks for:
- the site did not answer the last checks, with the time it stopped and the error underneath;
- the site refused the key, usually because the pairing was revoked on the site itself;
- PHP reached end of life and no longer gets security fixes;
- WordPress is behind the current release;
- a plugin or theme whose installed version has a published vulnerability, or a site whose plugin list could not be read to check (see Known vulnerabilities);
- the schedule is switched off, or its next run is overdue and has not moved;
- the certificate is close to expiring, or was issued for a name this site does not serve;
- mail stopped sending, with what the mailer said;
- a client key appeared on the site that nobody in the workspace accepted.
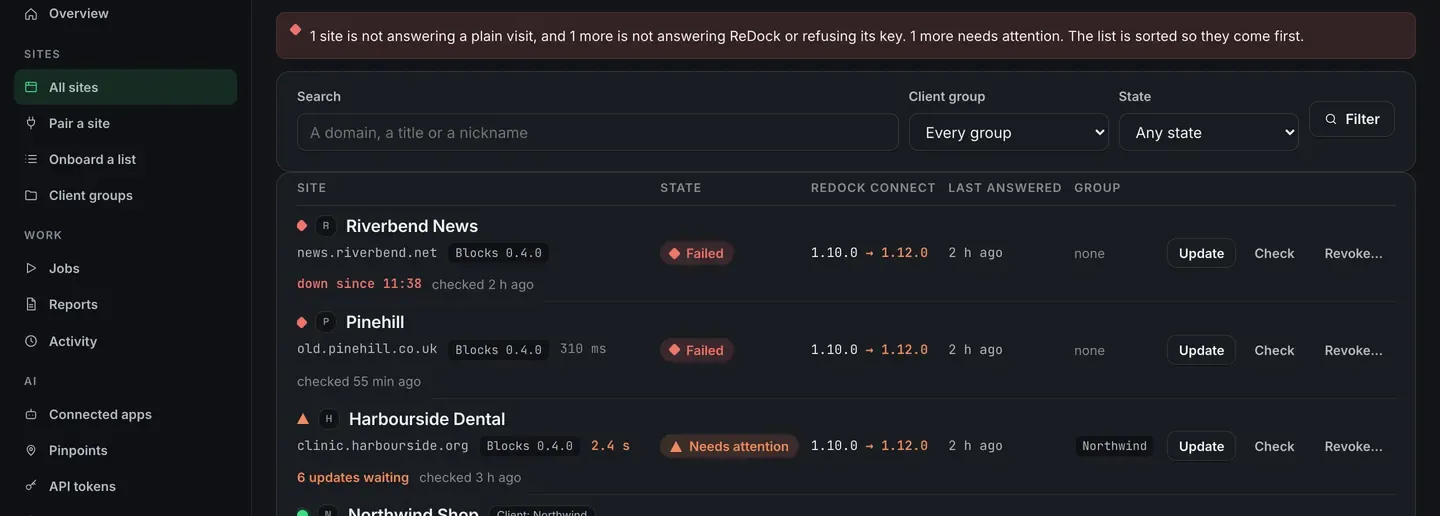
One missed check is not an outage. A host restarting does not turn the column red.
The All sites list sorts by what needs attention, so the top of the page is the work.
The Health tab on one site
Section titled “The Health tab on one site”A site’s own Health tab is the same reasons with the workings underneath: the certificate, the scheduled tasks that are overdue, and the system it runs on.
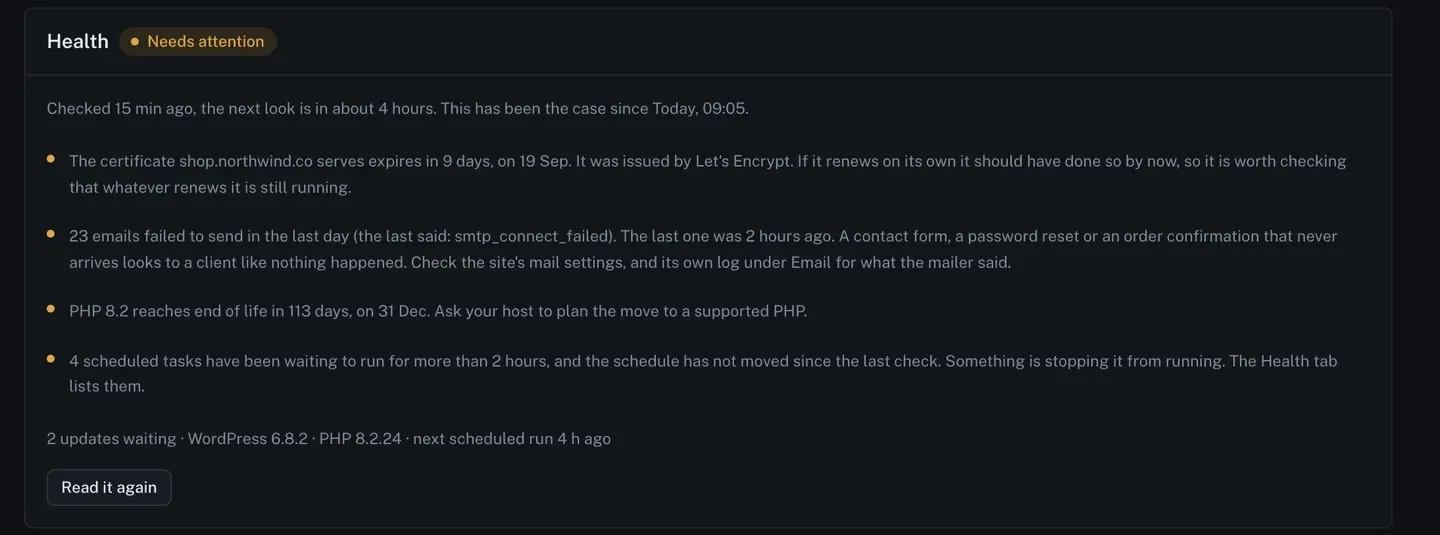
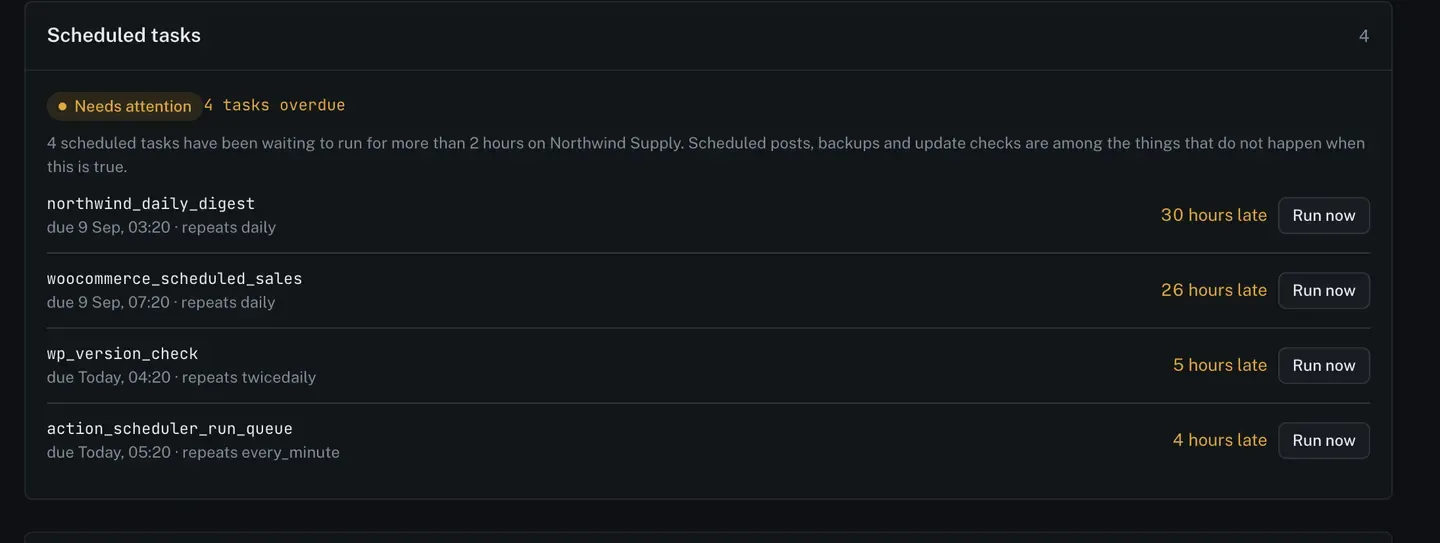
Overdue scheduled tasks are listed by name with how late each one is, and Run now starts one by hand. Scheduled posts, backups and update checks are among the things that stop happening when the schedule stalls.
Uptime checks
Section titled “Uptime checks”Under Settings, Uptime checks decides whether ReDock visits each site’s public address and how often.

- The visit carries no key. A site can answer ReDock and still be broken for its visitors, so this is the check that finds that.
- The sites list shows the result and the response time. The monthly report counts the visits.
- A site is called down after two visits in a row that got no answer, and comes back the first time it answers.
- A visit ReDock itself could not make, because of its own budget or its own error, is never recorded as the site being down.
Alerts
Section titled “Alerts”Alerts, also under Settings, is only about the email. Every site is checked and shown on your sites list either way.

A site sends at most one email a day however often it changes, and one more when it comes back to normal, which is never held back. News is a change. A site that has been broken since Tuesday does not email you again on Wednesday, because the page is where standing facts live.
The daily backup copies to Google Drive are not part of these emails. A copy that failed shows in Settings, under Google Drive, on that site’s row.
Uptime targets
Section titled “Uptime targets”A client group can carry a promise, and the group’s page says whether the month is meeting it.
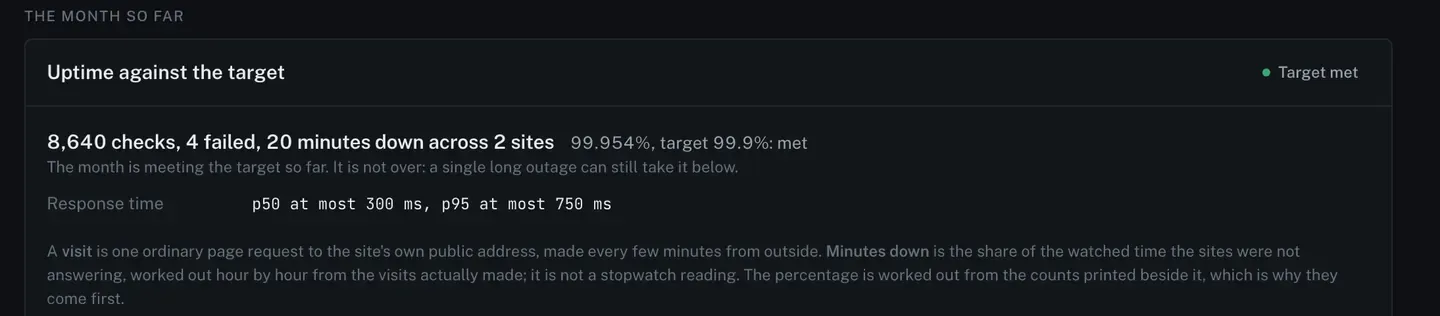
Set the promise on the same page. Three buttons offer the numbers most contracts say, and any other number can be typed. Leave the box empty and save to have no target at all, which is how a target is removed.

Minutes down is the share of the watched time the sites were not answering, worked out hour by hour from the visits actually made. It is not a stopwatch reading, and the percentage comes from the counts printed beside it.
The month
Section titled “The month”Everything above is written down as it happens, so the monthly report can be built from records rather than from questions asked at the end of the month. Uptime, the jobs that ran, what needs attention today, and the calls that were refused.