
The monthly report
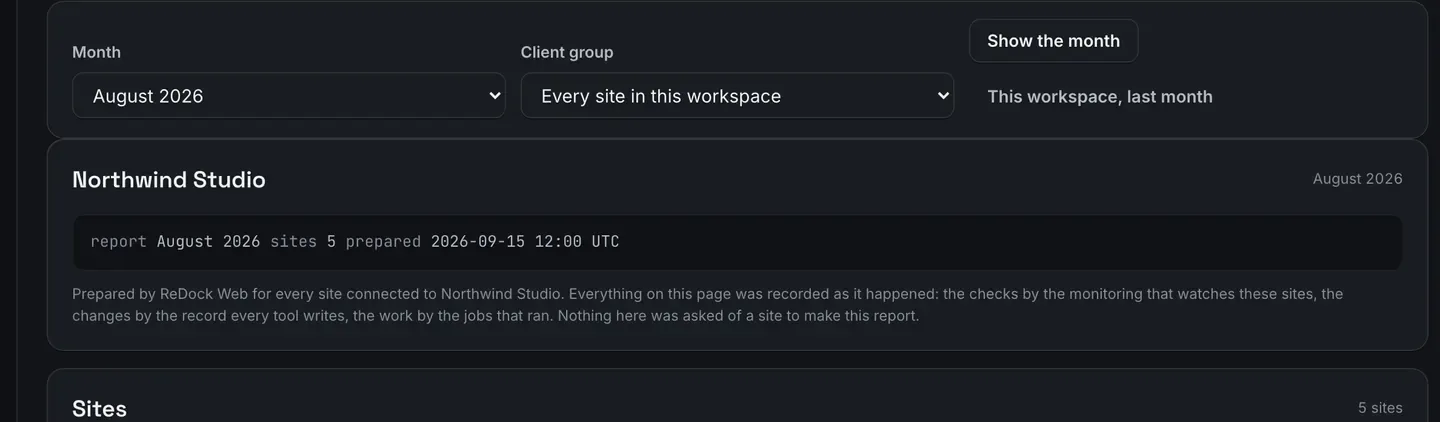
Reports builds one month for a client group or for the whole workspace. Nothing is asked of a site to make it: every figure on the page was recorded as it happened, by the monitoring that watches the sites, by the record every tool writes, and by the jobs that ran.
Build one
Section titled “Build one”- Open Reports.
- Pick the month and the client group, or leave the group as every site in the workspace.
- Press Show the month.
What is on it
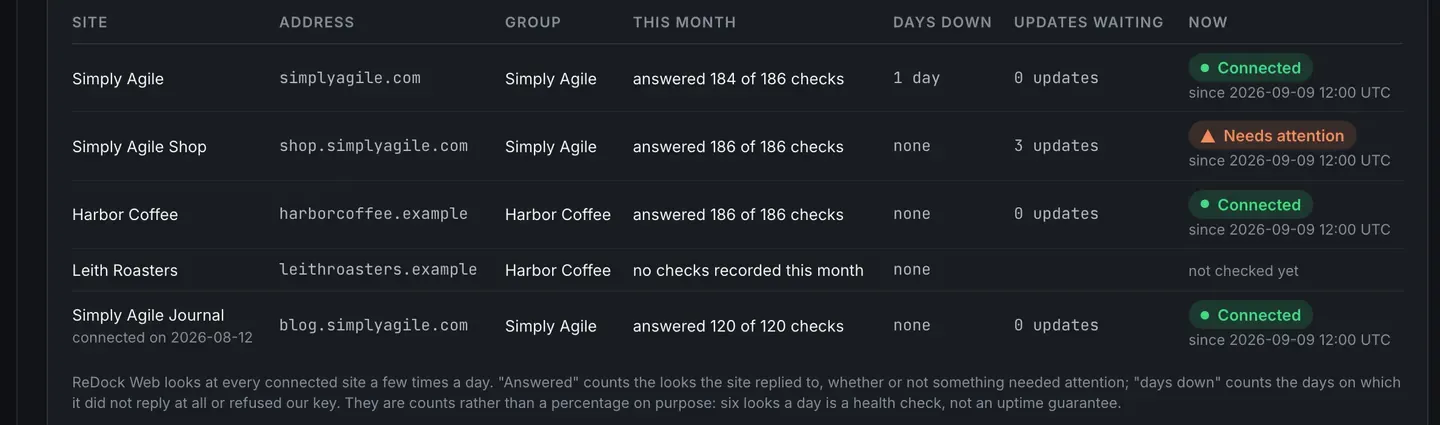
Section titled “What is on it”Sites. Every site in the report with its address, its group, how many checks it answered this month, how many days it was down, how many updates are waiting, and where it stands now. Counts rather than a percentage, on purpose.
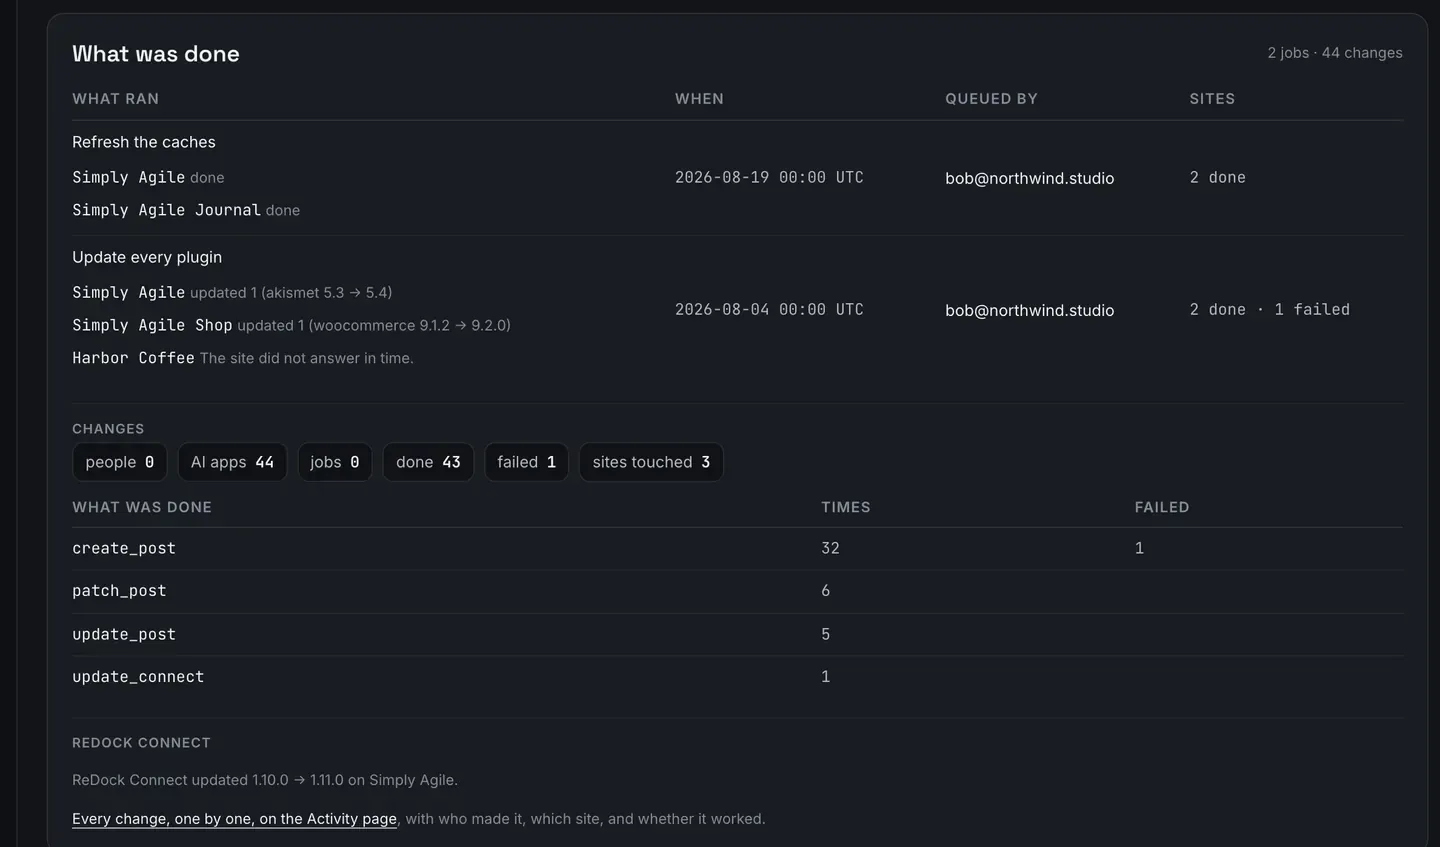
What was done. The jobs that ran, when, who queued them and how each landed, then a count of every change by the tool that made it, split by whether it was a person, an AI app or a job.
What happened on the sites. The changes the sites’ own people made in wp-admin, counted by each site itself and collected by the scheduled checks: pages edited, sign-ins, plugins and themes changed, settings changed, media uploaded. Who did each one is on the site’s own log, not on this report.
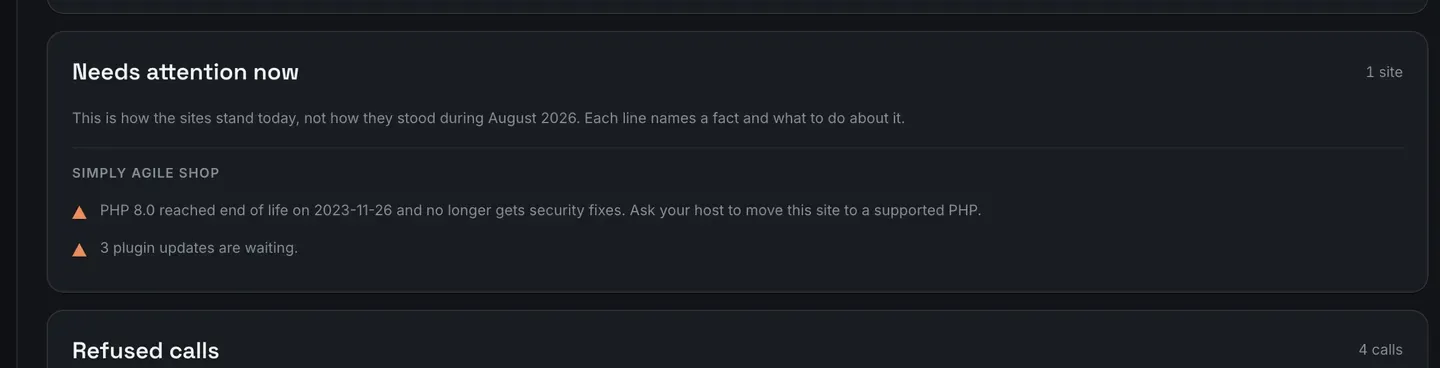
Needs attention now. This is how the sites stand today, not how they stood during the month the report covers. The section says so in as many words, because a client reading it in October should not think it describes August.
Refused calls. The calls a wall stopped before they ran, with the code and how many times. A refused call never reached the site, so it changed nothing, and the report says so.
Taking it away
Section titled “Taking it away”- Print is the report without the dashboard around it. It is a real print stylesheet, so it prints to PDF and reads on paper.
- Download CSV goes into a spreadsheet.
- JSON goes into whatever you already send clients.
The same rows sit behind all three.
How far back it goes
Section titled “How far back it goes”Changes are kept 400 days, a day’s checks 400 days, and a day’s counts of what happened on a site 400 days. Any month you have history for can be picked.
Only changes are recorded. Reads are not.
Sending it to the client
Section titled “Sending it to the client”A client group’s report can go to the client’s own people, on the first of the month, wearing your name instead of ReDock’s. See Reports in your own name.